
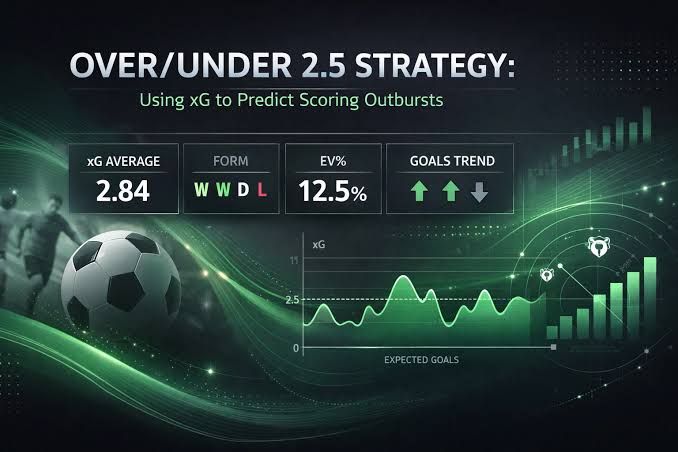
The 2.5 total goal threshold serves as the fundamental benchmark across international football betting markets, anchoring the pricing of alternative lines, Asian totals, and derivative propositions. In European football forecasting, the French top flight has historically carried a reputation for defensive rigidity, physical containment, and suppressed scoring metrics. The 2019/20 Ligue 1 season, curtailed after 28 matchdays due to the global health crisis, offers a robust empirical dataset to test whether this low-scoring reputation was mathematically justified or whether broad market perceptions obscured profitable over-total anomalies. Analyzing actual goal distributions alongside expected goals (xG) reveals significant structural divergences between elite outliers and the rest of the league.
Macro-Level Scoring Distributions Across the 2019/20 Campaign
Over the 279 fixtures completed during the 2019/20 season, Ligue 1 generated a total of 704 goals, resulting in an average of 2.52 goals per match. On a purely macro level, this average appears balanced precisely on the standard 2.5 benchmark. However, examining the binary distribution of individual match results exposes a distinct skew toward low-scoring outcomes, with 52.7% of all matches ending with Under 2.5 goals and 47.3% finishing Over 2.5.
The overall league average was heavily distorted by a small group of high-scoring teams at the extreme ends of the table. Paris Saint-Germain’s prolific offensive output (75 goals in 27 games) and AS Monaco’s high-variance defensive chaos inflated aggregate goal figures, masking the reality that the median mid-table fixture was characterized by low expected goal generation and tight defensive structures.
Empirical Breakdown: Over/Under 2.5 Distribution by Club Profiles
Dissecting the data by team-specific performance demonstrates that betting the 2.5 goal line effectively requires categorizing clubs into distinct tactical tiers rather than treating the league as a homogeneous entity.
The table below details the Over/Under 2.5 distribution across key squad profiles during the completed 2019/20 campaign, highlighting how individual tactical systems drove market outcomes.
| Team Profile | Representative Club | Total Matches | Over 2.5 Matches (%) | Under 2.5 Matches (%) | Goal Average per Match |
| Elite Offensive Outlier | Paris Saint-Germain | 27 | 19 (70.4%) | 8 (29.6%) | 3.67 |
| Defensive Low-Block Specialist | Stade de Reims | 28 | 6 (21.4%) | 22 (78.6%) | 1.68 |
| High-Variance Transition Unit | AS Monaco | 28 | 19 (67.9%) | 9 (32.1%) | 3.14 |
| Pragmatic European Contender | Stade Rennais | 28 | 12 (42.9%) | 16 (57.1%) | 2.29 |
| Relegation Grinder | Dijon FCO | 28 | 11 (39.3%) | 17 (60.7%) | 2.18 |
This empirical breakdown reveals striking polarities. Stade de Reims delivered an overwhelming 78.6% Under 2.5 strike rate due to disciplined aerial containment and compact spacing. In stark contrast, AS Monaco cleared the Over 2.5 line in 67.9% of their fixtures because an explosive front line was paired with a catastrophic transition defense, illustrating that generic league-wide assumptions consistently fail at the team level.
Mechanics of Expected Goals Deficits in Mid-Table Fixtures
In matches between teams positioned 7th through 16th, the combined non-penalty expected goals (npxG) averaged just 1.84 per ninety minutes. Tactical setups in this tier focused primarily on crowding central zones and forcing play to the flanks, where crossing sequences carried low conversion probabilities. This mechanical suppression of chance quality made mid-table clashes structurally resistant to high-scoring outcomes.
Home and Away Splits: The Asymmetric Nature of Match Totals
Scoring distributions in French football exhibit pronounced venue-specific asymmetries that directly influence the viability of the 2.5 goal market. Host teams frequently adopt proactive possession setups that elevate their vulnerability to counter-attacks, while traveling sides prioritize compact defensive shells.
Analyzing venue splits across the 2019/20 data highlights several critical operational patterns:
- Home Favorite Over Rates: Matches featuring top-six home favorites cleared Over 2.5 at a 58.3% rate due to aggressive territorial pressure and multi-goal outputs.
- Mid-Table Home vs. Away Grinds: Clashes between mid-tier clubs produced Under 2.5 in 63.2% of fixtures when the home side lacked an elite central creator.
- First-Half Goal Suppression: Across all completed matches, 58.8% entered half-time with zero or one goal scored, keeping full-match under lines viable well into the second half.
- Late-Game Escalation in High-Pace Matchups: Encounters involving high-pressing units saw 34.2% of their total goals scored after the 75th minute due to physical fatigue.
Evaluating these situational factors ensures that total goal wagers reflect specific venue dynamics rather than aggregated home-away statistics.
Price discrepancies across total goal lines frequently emerge when public volume overreacts to recent high-scoring anomalies. When objective probability modeling indicates that bookmaker totals are misaligned with underlying defensive baselines, monitoring market movements via a specialized betting platform like agent ufabet168 enables sharp analysts to secure advantageous pricing on alternate Asian totals (such as Over 2.25 or Under 2.75) before late liquidity corrections occur.
The Disconnect Between Shot Volume and True Conversion Efficiency
A common pitfall in total goal analysis is equating high raw shot counts with over-goal value. Several French clubs recorded high shot volumes per game while maintaining low conversion rates, primarily because their attempts originated from low-probability locations outside the eighteen-yard box.
Teams that settle for speculative long-range efforts inflate basic box-score metrics without generating genuine expected goal pressure. Conversely, teams that generate fewer total shots but consistently penetrate the six-yard box produce higher actual goal outputs. Dissecting shot location profiles is therefore essential to avoid backing misleading over-total setups.
Navigating sports wagering markets requires the same mathematical discipline applied across the wider digital entertainment landscape. In modern environments where sports betting operates alongside full-scale web-based service offerings for recreational gaming, maintaining a rigorous focus on expected value and statistical modeling ensures that selections remain grounded in empirical reality.
Comparing High-Volume Perimeter Shooters with Low-Volume Box Converters
A team averaging fifteen perimeter shots per match typically generates roughly 0.75 to 0.90 total xG, as shots beyond twenty yards convert at less than 4%. In contrast, an efficient counter-attacking team generating only seven shots—four of which occur inside the penalty area—consistently generates upwards of 1.40 xG, producing significantly more three-goal scorelines despite lower superficial activity.
Structural Hazards: When Empirical Total Models Fail
Even models built on robust historical data can fail when unquantifiable matchday shocks alter the game environment. Recognizing these structural vulnerabilities is vital for protecting capital against statistical outliers.
The primary points of analytical breakdown include:
- Early Disciplinary Red Cards: A dismissal inside the opening twenty minutes completely destabilizes defensive shape, accelerating scoring for the advantaged side.
- Severe Goalkeeping Errors: High-profile shot-stopping blunders on low-threat attempts that instantly break a planned low-block game state.
- Fluke Set-Piece Efficiency: Defending units converting two low-probability corner routines against the run of play, forcing the opponent into an emergency attacking posture.
- Adverse Surface Conditions: Saturated pitches that neutralize intricate attacking buildup, turning an expected high-scoring clash into a muddy, low-event stalemate.
Filtering fixtures through these qualitative risk checks ensures that total goal selections account for operational volatility as well as statistical trends.
Summary
The 2019/20 Ligue 1 season provided clear empirical evidence that the 2.5 goal market cannot be approached with broad league-wide generalizations. While aggregate metrics showed a slight 52.7% lean toward Under 2.5, significant polarization existed between high-variance outliers like PSG and Monaco, and ultra-disciplined defensive units like Reims. Profitable execution on total goal lines requires evaluating underlying expected goals (xG), shot location quality, and home/away tactical splits rather than relying on raw scoring averages. By isolating high-efficiency attacking matchups and fading low-quality shot-volume games, bettors can systematically uncover value across both over and under propositions.
